What you will learn here:
In this lab you will learn about:
- SLO concepts and how using SLOs, Error Budgets and Reliability changes the way you think about reliability
- We will create an SLO, apply an alert policy to it and review some reports.
Please check your SLOCONF workspace messages
Oh and one more thing, thanks for coming to SLOConf. We are so grateful that you are taking the time to connect with the community! Please feel free to share your Lab experience with others! Finally, if you enjoyed the contents of this lab, be sure to drop a line to our friends at Isos Technology.
Let's get started!
Service Level Objectives (SLOs) are the key to the ultimate value proposition for any business. They give you the visibility to ensure that your products and services are meeting your expectations of your customers' experience. SLOs also provide you with the framework to be confident not having 100% reliability in a planned way. It's a win / win.
If you're new to SLO and how it relates to SRE, please watch this short introductory video on why SLO is important and why it's exciting.
In this longer video you'll learn the method at a logical level, behind the math and computer science that drives SLOs. You'll also learn why Nobl9 built the Nobl9 platform. We will also discuss error budgets and how to use them.
How do we tie reliability objectives to customer satisfaction? How would it change how we work if we stopped focusing on how reliable we can make individual systems? These systems combined, make up our product and we need to get smart about how all of our systems affect customer happiness.
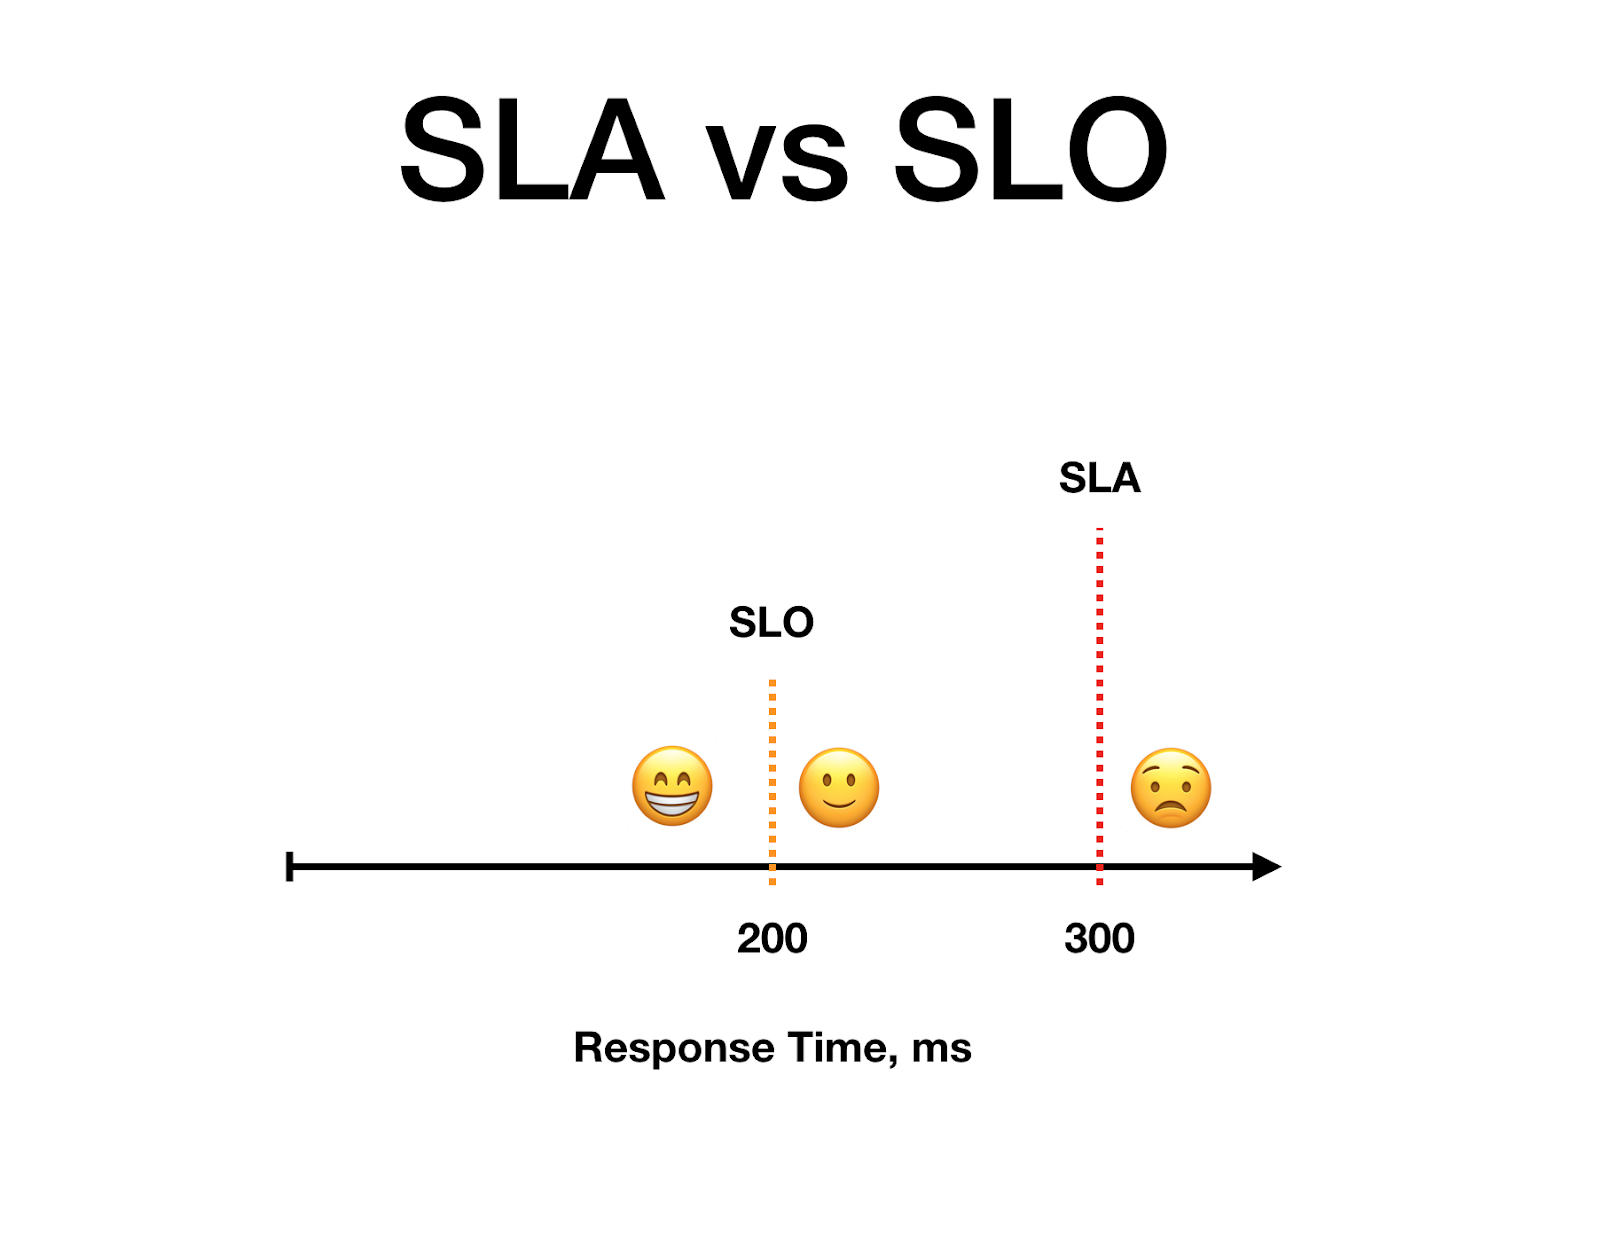
Reliability is a function of customer happiness. But SLAs measure total dissatisfaction at a contractual level. The A stands for Agreement, as in a legal contract with money and significant negative strategic (reputation) and tactical (wasted work) effects. What happens when we also use reliability objectives tied to customer happiness? We call these Service Level Objectives (or SLOs).
Using an SLO and an Error Budget is relatively easy, conceptually. But the math involved and getting everyone on the same page can be challenging.
The Nobl9 platform was created to help teams do this harder work. Nobl9 ingests the SLIs that you choose from your various data sources, allows you to define your SLOs in a wizard or via SLOs as code and then calculates your error budget for you. The SLOs are displayed in a clean organized view which makes it easy for stakeholders with both limited and high technical aptitude to easily be able to see the health and trends of their SLOs.
Below are some of the many benefits of using error budgets, (we won't have time to cover all of these in the lab today):
- It changes the way you think about reliability. It's about making reliability a part of the product. Customer Happiness is why we create new features, but we also have to build on past success. This means that we can work as one team to prioritize both reliability and new feature development.
- Prior to using an Error Budget we see teams prioritizing work based on individual system reliability or perceived / inferred customer satisfaction. The teams that get the most out of this approach, continuously improve their model for client expectations relating to reliability
- When we include user happiness, this tells us where we are over-engineering for system reliability which often reaches a point where the amount of work wildly exceeds the client's vaguely modeled expectations for reliability, often massively exceeding it.
- It helps us notice the velocity of customer unhappiness and can be codified in policy to even agree that an incident did not actually occur just because there was a Service Level Indicator out of bounds. With an Error Budget you give the entire product team the ability to see Product's reliability investments in a way that allows you to prevent "the death of a thousand cuts'' that can come from metrics that are not specifically connecting specific Customer Happiness objectives to an Error Budget.
- Error Budgets allow your team to accept unreliability. Accepting any unreliability, enables your team and your organization to make better decisions when improving the reliability of the product as a whole. More effective systemic and long term solutions are more visible, because the problem we are solving for always has to have two parts:
- How much can we improve reliability targets?
- Do our customers care? Are we helping our typical customers too, or are we just improving reliability for our "most important" customers.
We've prepared the lab environment with example services and SLOs to get you started.
This lab is a shared environment. Please do not edit the example SLOs or those of other users. Please limit your changes to the SLOs in the services that you will create.
First, you'll need to obtain a login credential from here
- Login to the Nobl9 App!
https://app.nobl9.com
Your lab account credentials should have been sent to you when you completed the form above, don't forget to check your spam folder if you can't find it
If you can't find it we can slack you in the SLOconf slack workgroup. Ask for help in the #sloconf-labs-nobl9 channel!
We suggest you open a new browser window so you can easily glance back and forth between this lab and the app.
Upon successfully logging in you should be greeted by the SLO grid view which will have SLOs laid out by their respective services. Feel free to look through them, clicking on the SLO name or Reliability Burn Down chart will open up a details page.
These SLOs in this lab are solely for the purposes of this lab, and should not be taken as demonstrating poor service by the providers. Also the time windows have been set as 1 hour rolling windows, in the real world these are usually 28 or 30 days, and have larger error budgets. 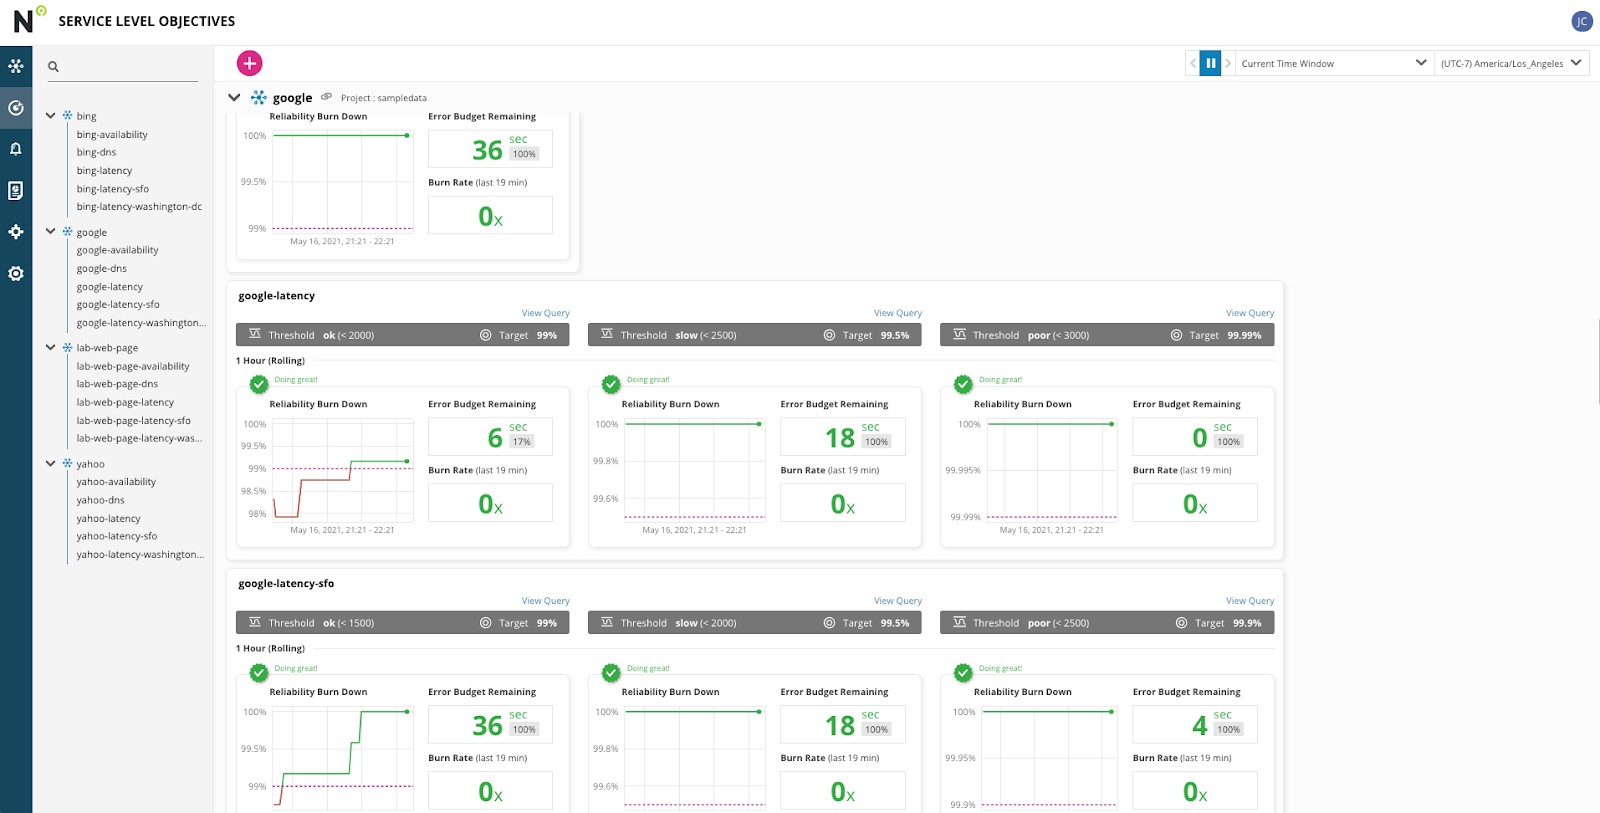
You can use the time picker to expand the chart time windows.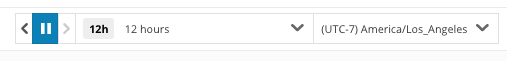
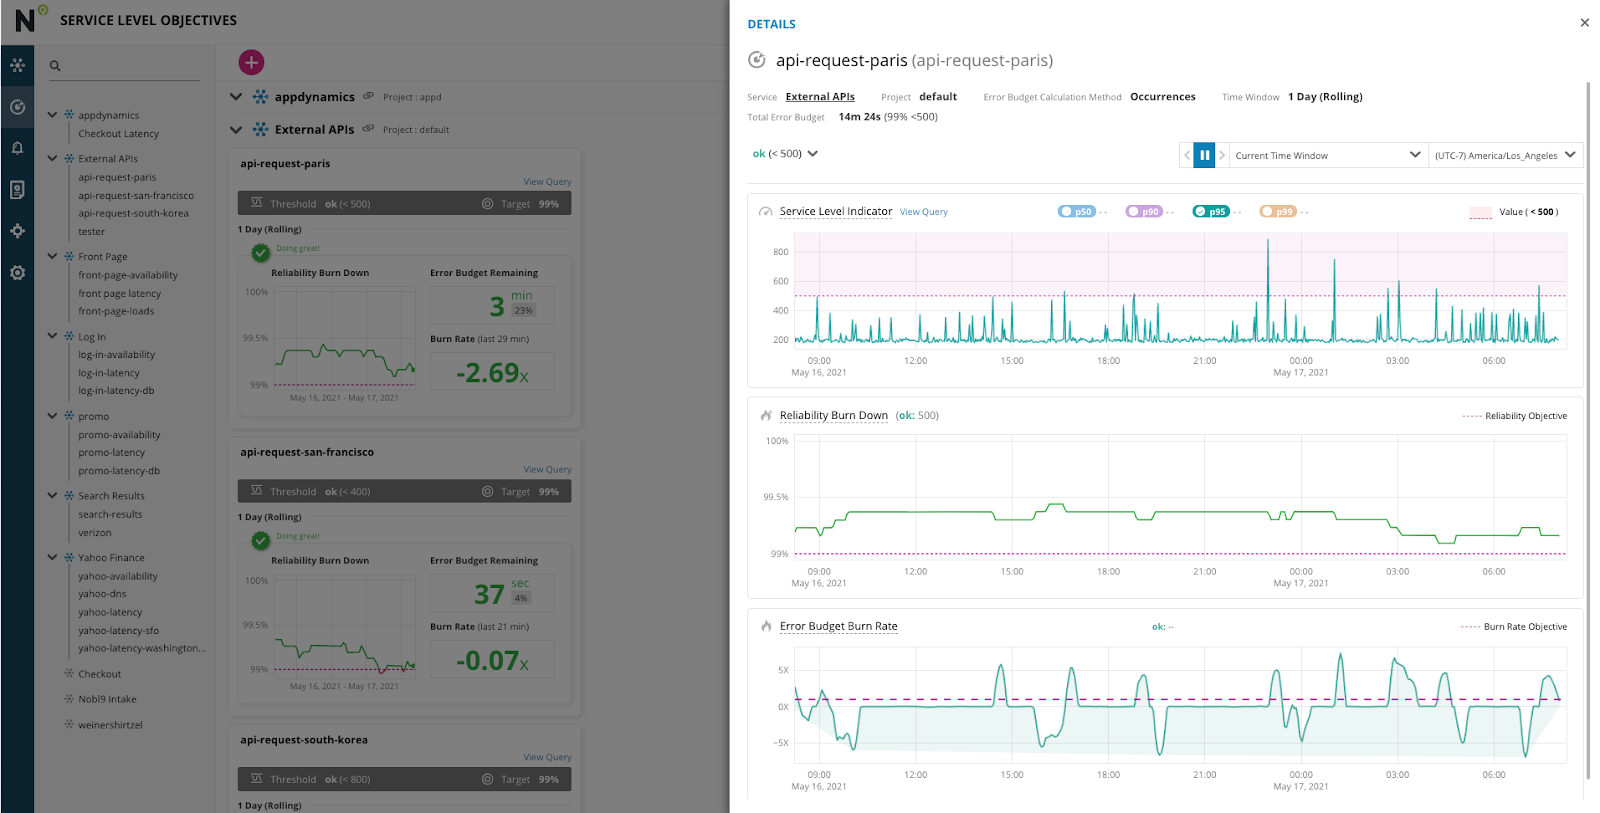
By clicking on the SLO name on the reliability burn down chart you can see the SLO Details page. Here you can find details about the SLO, see the SLI metrics and how it compares to the threshold, an expanded Reliability Burn Down chart, and an Error Budget Burn rate chart.
- Creating a Service
- Click on the Services List (if it's not already selected) by clicking this icon in the left navigation

Your screen should look like this:
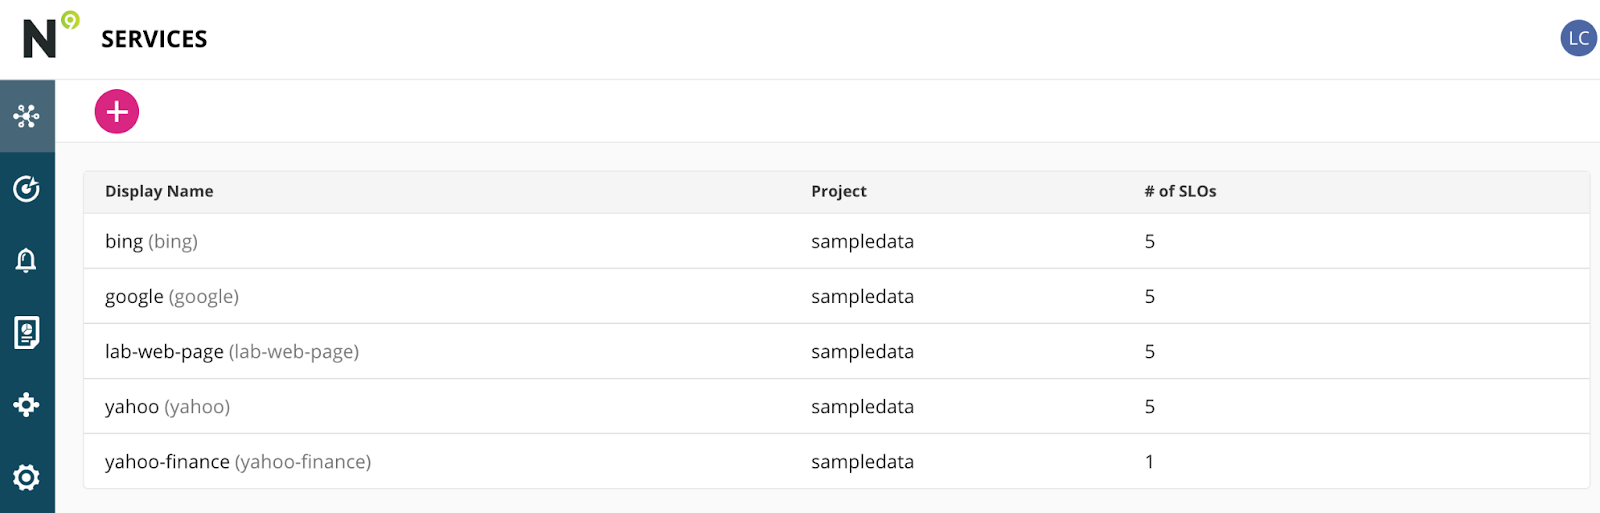
- Click the Pink Plus button to create a new Service
- You can create your own project name - if left blank it will revert to "default"
Enter a unique "Display Name" that you will remember - the "Name" field will auto populate.
We recommend using your name or initials in addition to some sort of "product" name, but it's up to you. - Raise your right hand and say aloud:
"I will not edit other Lab Participants SLOs (in the services they create)."
(This oath will make sense after you do the next bit, it's pretty fun.)
Ok, create your first SLO!
- Now let's step into the shoes of an SRE at yahoo who has been tasked with creating an SLO. The SLO based on a latency SLI from a synthetic test checking the yahoo.com url An alert will also be needed, and it will be to be sent via slack. The SLO reads as follows:
A one hour rolling window with a target of 99% of the pages completely loading all resources in less than 6,000ms - If you aren't already on the Service Level Objectives view, you can get there by clicking this icon on the left navigation bar:

- Click the Pink Plus icon to create a new SLO. It's the only pink thing on the page.... This will open the Nobl9 "SLO Wizard".
Step One: Select a Service
- Choose the service you created In the Create a Service step earlier in this lab exercise
- It should look like this.
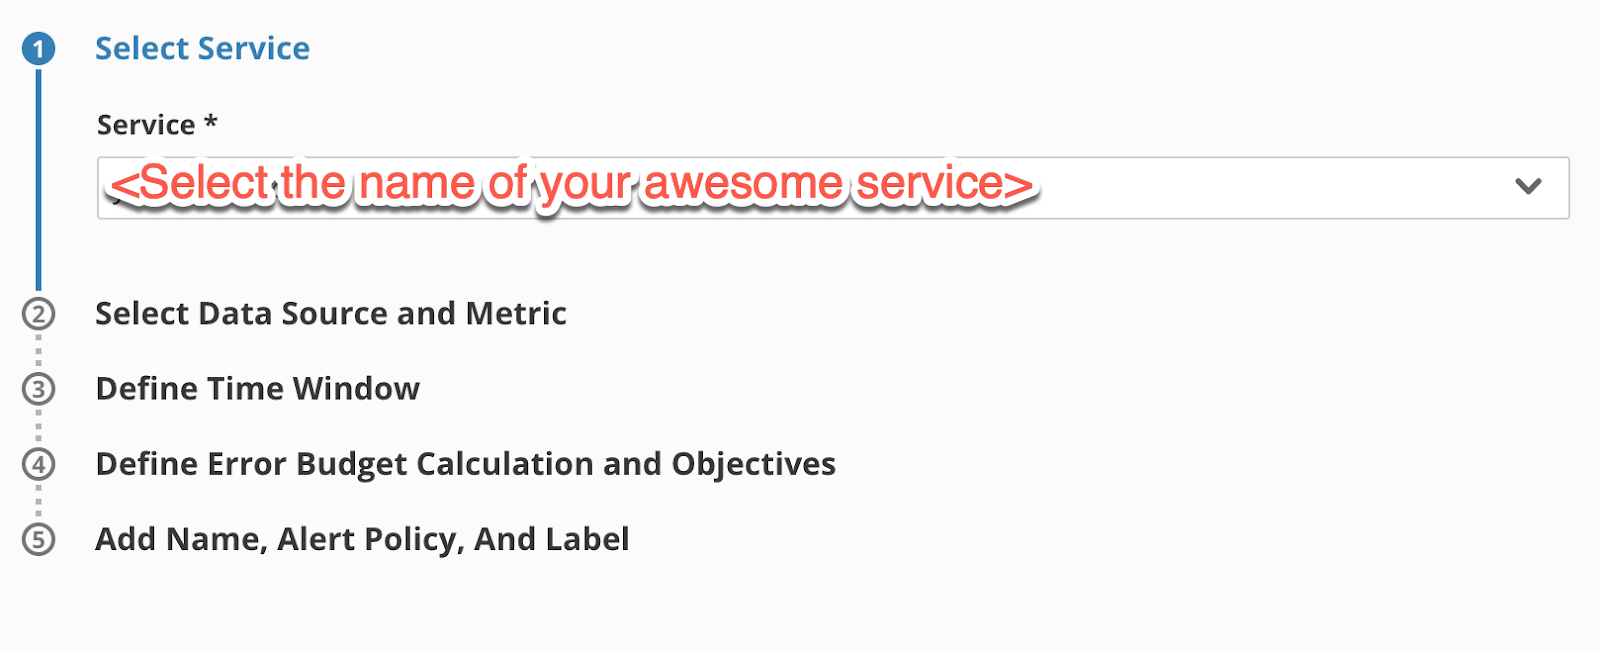
Go to step two by clicking on the Step 2 Heading (this is how you navigate all the steps, and you can jump back and forth if you missed something or need to go back and change something).
Step Two: Select a Data Source and Metric
- Select the
sloconf-labdata source, a two panel element will appear - In the Threshold metric field, enter the following query to retrieve the latency SLI for the latency from our data source:
SELECT average(duration) FROM SyntheticCheck WHERE monitorName = 'yahoo' TIMESERIES
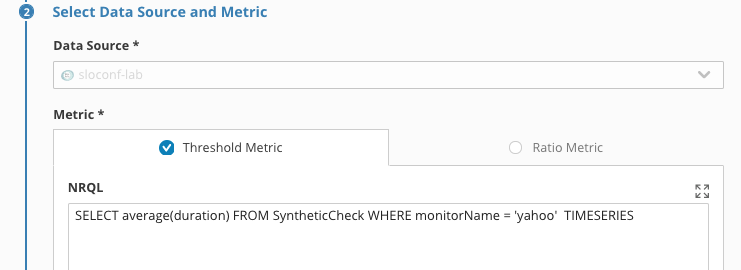
In this case it's New Relic data, but it could be from a growing list of data sources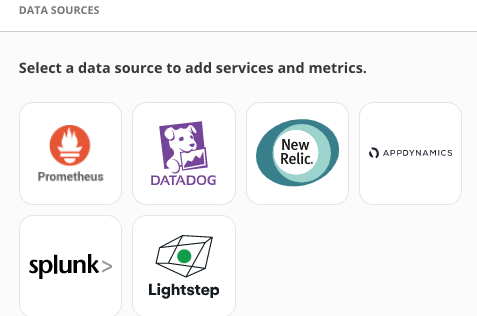
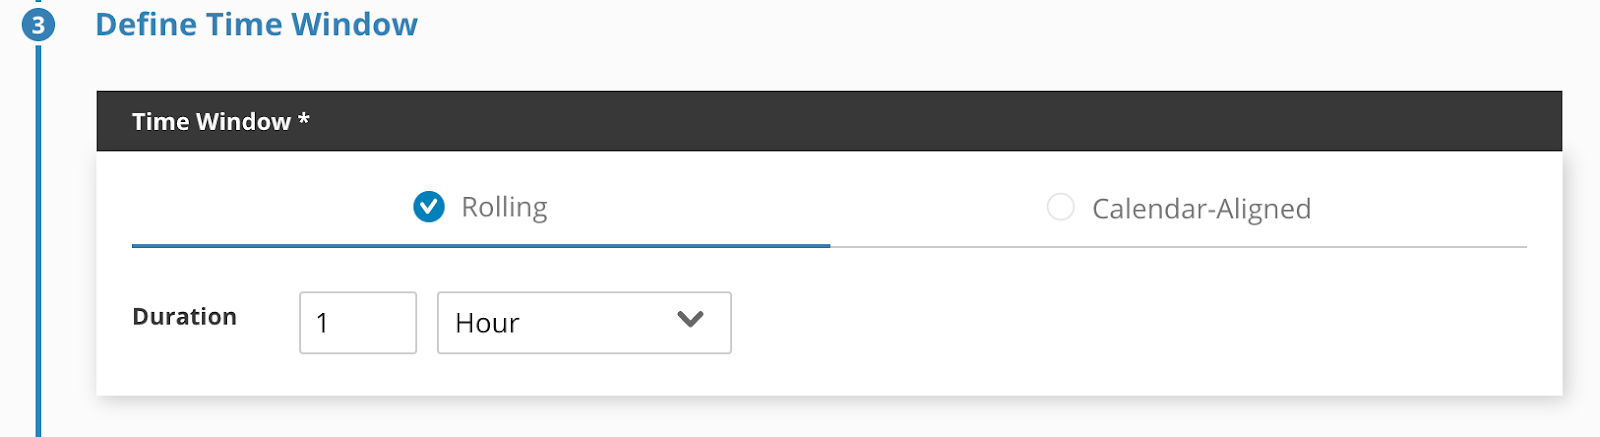
Step Three: Defining Time Window
- The SLO we were given had a 1 hour rolling time window so we will choose that. Notice you can set rolling time windows in Minutes, Hours, Days or Months. You should also notice that you also have the ability to select Calendar-aligned time windows with durations in Days, Weeks, Months, Quarters or even a full year. That's right we keep the raw SLI metrics for over a year.
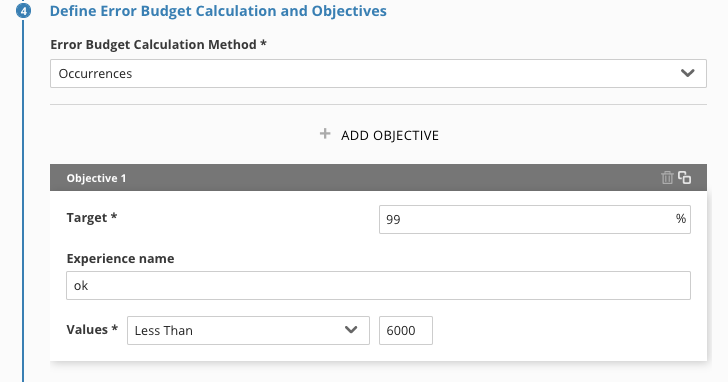
Step Three: Define Error Budget Calculation and Objectives
- Choose Occurrences for the "Error Budget Calculation Method"
- Define a target of ‘99' (two 9's)
yep, not even one decimal place. That's a 99.00000% target, it's a lab example. - Name the experience ‘ok'
- Set the threshold at less than ‘6000'
Step Four: Name you SLO and assign the Alert Policy
- Enter your display name: ‘yahoo-latency-<yourlastname>.
- Add a description if you like
- Add the Alert Policy that we have pre-configured for our Lab today ‘sloconf-alert'. Outside of this lab it is possible to add multiple alert policies to an SLO.
Sloconf -alert is an abnormally strict policy for the use case of this lab, alerting when the error budget drops down to 99%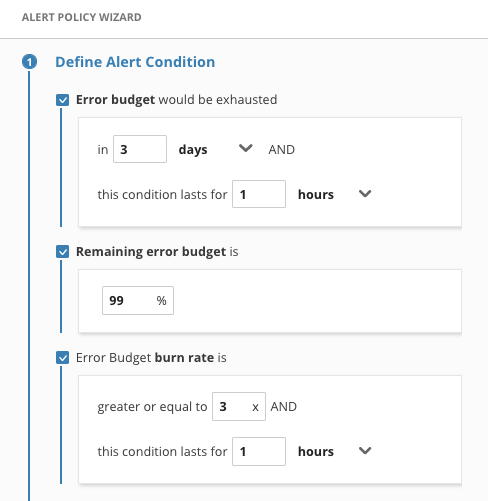
(the error budget and burn rate alerts were only checked for the screen shot to display all types of alerts)
When the alert is triggered, a webhook is sent to the SLOconf slack channel#sloconf-alertsYou can find yours by looking for your SLO name.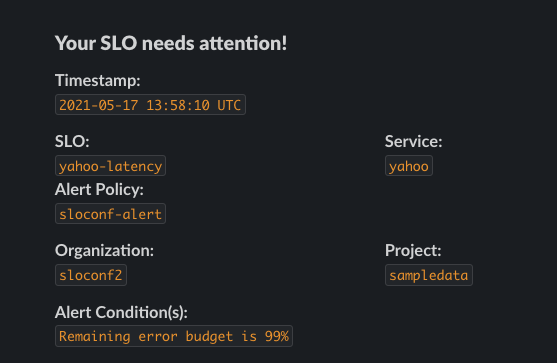
Click Apply in the lower right to save you SLO.
- Now that your SLO is created you will be able to view it back in the grid view on the main page. You will be able to jump right to your service or SLO using the search feature in the upper left.
Using a similar step by step process you saw when you created your first SLO, you can see how we create an Alert. Let's go ahead and look at the Interface.
- Select the Alerts icon

- Click on the Pink Plus sign to create a new alert.
- Select all three checkboxes to see the parameters available
Your configuration screen should look like this.
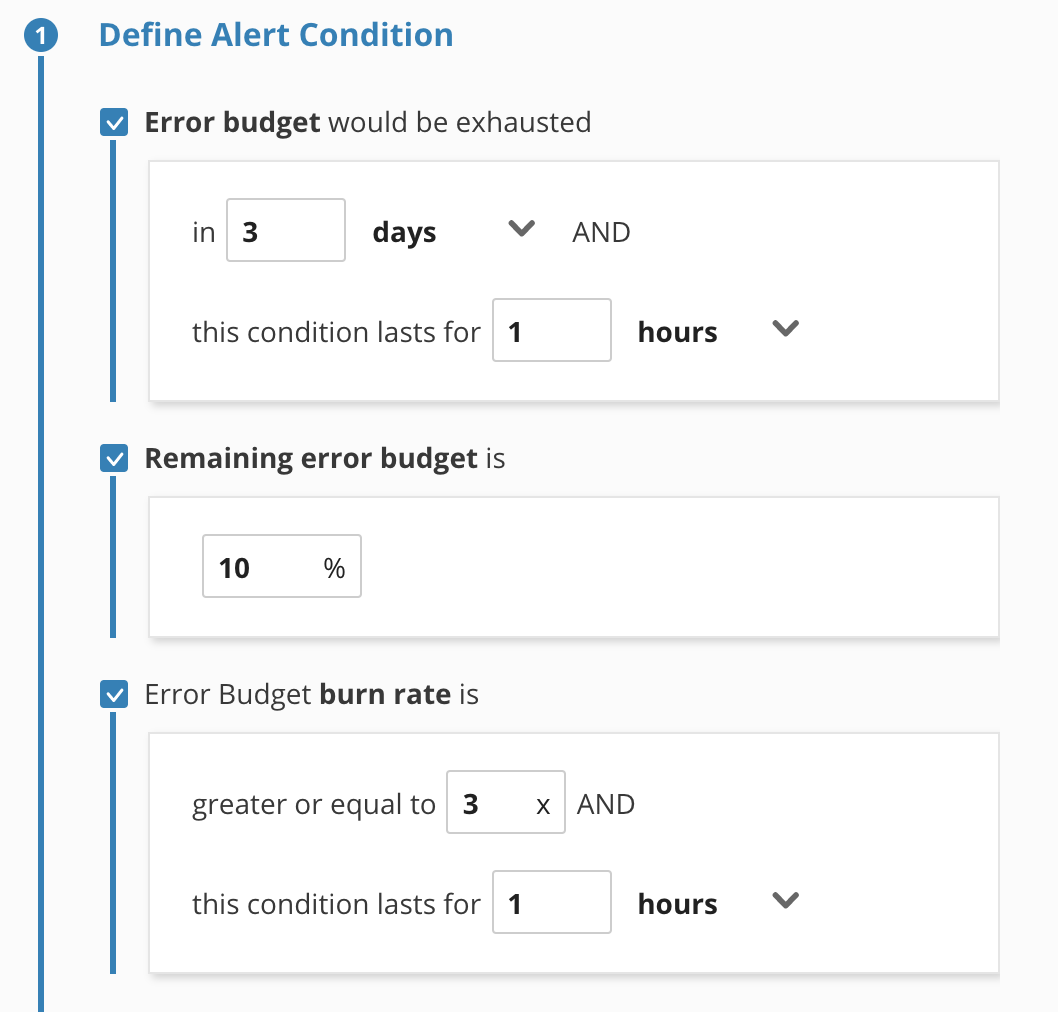
The first step, Define Alert Condition, is really the main configuration and it's pretty light in terms of the amount of data it asks for. It's kind of surprising, isn't it? It's very important that you notice this simplicity because this is another place where the efficient flexibility of Nobl9 really shines.
An alert policy can be tied to multiple SLOs. These alerts are proactive webhooks to make your team(s) aware or trigger automation before the error budget is exhausted. You can leverage pre-configured webhook destinations or just send the webhook to anywhere that accepts them. 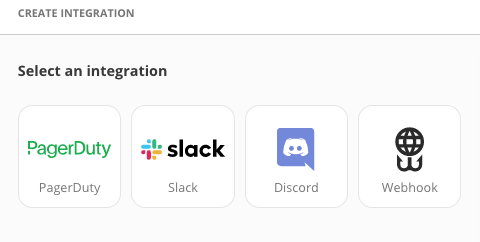
From an SLO based SRE perspective you really only need alerts when your error budget is
- close to being exhausted
- rising at, literally an alarming rate, right now
- trending to be exhausted in a certain amount of time
With these alerts, you now are empowered with the ability to be alerted when customers are actually being impacted. What if your incident response team was only alerted on trends and spikes directly related to customer happiness? This can reduce pager fatigue and also be used as reference to determine if a regular monitoring alert is actually impacting users.
Nobl9 dynamically calculates the Error Budget as it receives the data. If you are using a rolling time window, as is often the case, when reliability rises, the Error Budget is replenished. On a calendar time window you don't get it back until a new period starts. Your customers can be at varying levels including ecstatic beyond their wildest dreams, pretty satisfied, and very dissatisfied.
The Error Budget is how we can more easily see the problems that are affecting customer satisfaction. Without an SLO we don't have a target level of reliability. And without a measurable level of unreliability we can't make changes with knowledge of where we stand with our level of service. We can find a balance between the floor dissatisfaction, and the ceiling of 100% reliability. If we know how to find that balance, we can also balance how many new features and how many site reliability improvements we can make in the near term and the long term.
We can improve the product by adding new features and improve reliability at the same time.
We completed our earlier task by creating an SLO and sending an alert to Slack. Alerting is great for helping you be proactive and keeping everyone in the loop but what about the past? That's where reports come into play as they can help you look at long periods of time enabling you to make more informed decisions down the road.
- Click on the Services List (if it's not already selected) by clicking this icon in the left navigation

- Click on ‘SLO history (Rolling)' to expand the Reports settings
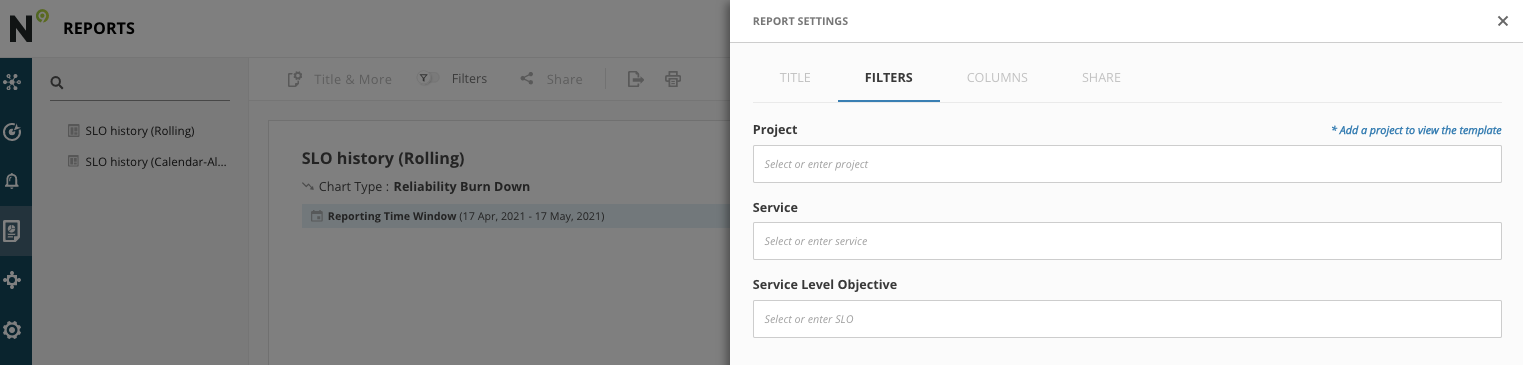
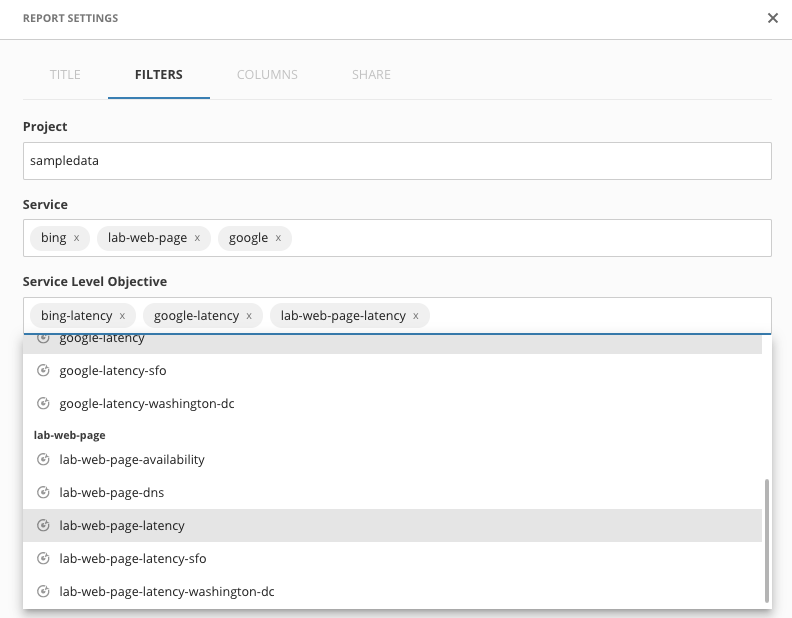
- We will now choose the ‘sampledata' project and any of the services and SLOs that you want, feel free to choose more than one. Since the one that you just made is new it won't have that much data to display
- When you are done click apply and your report will be generated. If you want to make changes use the filters icon in the menu bar up top.
Since the SLOs are all pretty new, you may want to use the time picker to change your view to the past 7 days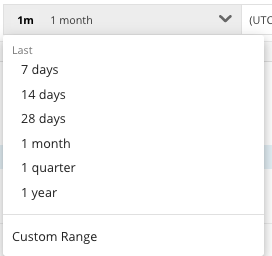
Since we keep the SLO data for over a year these reports can be pulled for extended periods of time. We also give you the ability to export these reports to an S# bucket, GCS or Snowflake with more one the way.
Usually teams like to see the math play out. Agreeing on your first SLO's and Alert policy configuration starts you on the journey of SLO Based SRE. The real, and very effective work is beginning a more pragmatic dialog between all of the stakeholders.
Often teams start working on really attacking the systems that were causing very slow burn or very spiky reliability issues, because they can now see what parts of those systems are contributing to customer satisfaction.
The first few weeks can be pretty giddy, but it's also the beginning of improving your SLO and Alerting configurations.
Then you really get the whole picture. Model the objectives to map to a customer satisfaction tiered scale. When customers are just barely satisfied, you can be working on planned work to get them to the next level up. What's always fun is when we get the model accurate enough that you realize your SLOs are providing better incident response signals then you've ever had before.
We've got some ways you can modify the SLO you created earlier, in the next module.
Go ahead and play around with the interface.
If you want to tweak what you did in the lab exercises, we have some suggestions in the next module.
This is the end of the guided lab!
Congratulations!
These are some other ideas to get you thinking about how you can play with the SLO configurations connected to our sample SLI monitoring data sources.
Create Additional Objectives
For the Objective you created in this Lab here are some alternate configurations to play with:
Try adding more objectives, with a different target, percentage, and experience name.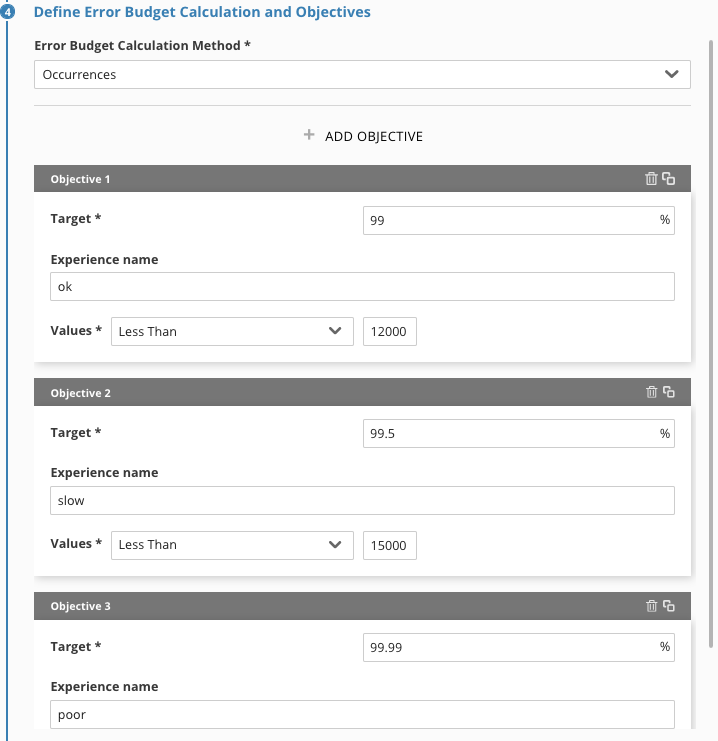
Notice that modifying an Objectives value will reset its history.
Add a new SLO, based on a new query
Below are some additional queries that you can try in new SLOs
SELECT average(duration) FROM SyntheticCheck WHERE monitorName = 'yahoo' AND locationLabel='San Francisco, CA, USA' TIMESERIES
SELECT average(duration) FROM SyntheticCheck WHERE monitorName = 'yahoo' AND locationLabel='Washington, DC, USA' TIMESERIES
Create a new alert
Our configuration will only send alerts to the sloconf alerts channel.
If you create a new SLO (and set it to use your new alert) it won't have an error budget calculation for a while. So the alert won't fire right away. But check back in and you should see it firing.
SRE - Service Reliability Engineering, the practice of designing and maintaining a system from a reliability perspective. Usually measured in terms of services availability, (service responsiveness, latency, throughput et. al.), to ensure compliance with reliability targets.
SERVICE LEVEL OBJECTIVE (SLO) - An SLO is used to prioritize and decide how much effort to invest in activities that improve customer happiness. They are not only used for SRE but they are very important to SRE.
CUSTOMER HAPPINESS A tiered measure of how happy or unhappy a customer is with the reliability of a product (not the systems that deliver the product).
ERROR BUDGET Specifically, and under what conditions do we all agree: How much Customer Happiness we are willing to sacrifice so we can continuously improve our entire product.